The graphs are sampled every 15 minutes.
 |
||||
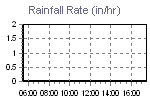
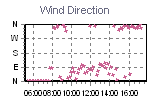
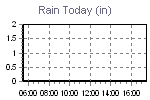
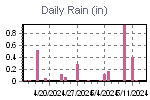
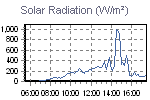
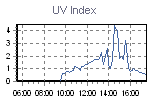
| Click on a thumbnail to show a large graph in the panel above. | ||||
 |
 |
 |
 |
 |
 |
 |
 |
 |
 |
 |
 |
 |
||
powered by
Cumulus v1.9.4 (1099)
|
||||
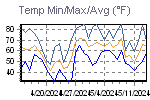
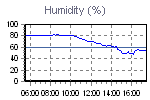
| Click on a thumbnail to show a large graph in the panel above. | ||||
|
|
|
|
|
|
|
|
|
|
|
|
|
||
powered by
Cumulus v1.9.4 (1099)